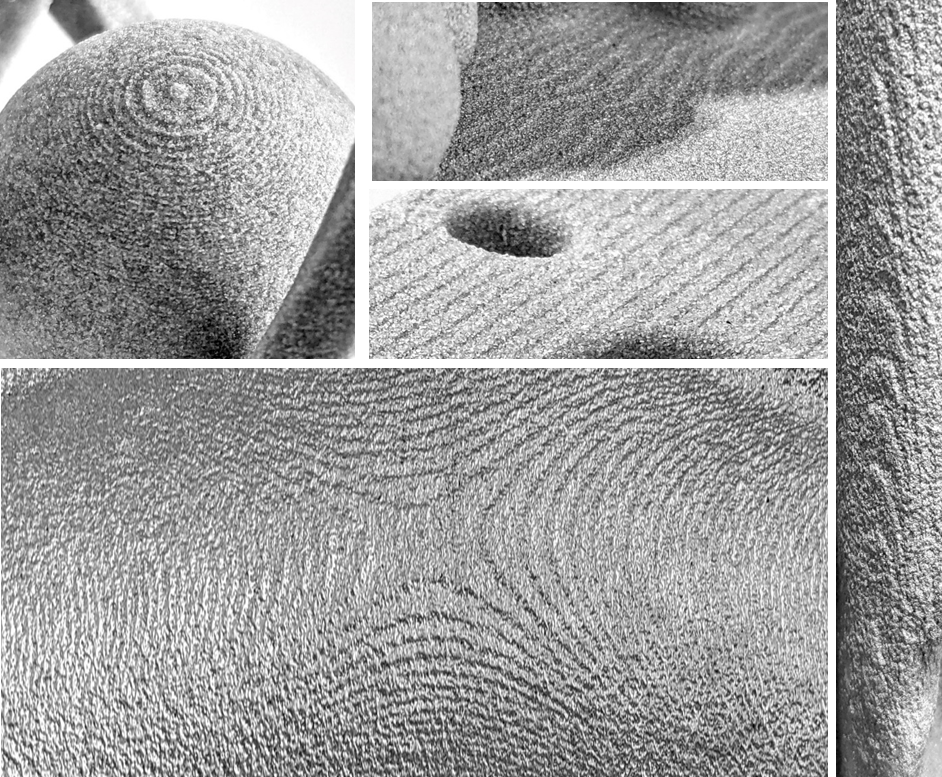
The results of the data manipulation presented show that the steps can be resolved using suitable gradients. Optical 3D scans of the surfaces revealed that the remaining deviation from the 3D model lies within a range smaller than a medium-sized grain of sand. The change in component colour is remarkable: in conventional printing, the component has a uniform dark green colour, whereas, in smoothed printing, darker areas can be seen in the former step fillet. This is due to the increased concentration of the binder in these areas.
With regard to the casting technique, the question arises as to whether the increased binder content leads to an increase in gas porosity. Micrographs of castings showed no signs of an increased gas tendency. The resulting gas porosity appears to be unaffected by the local change in binder content. One explanation for this could be that a local increase in the binder content, as shown above, also binds additional sand to the mould and therefore only marginally changes the actual binder content.
Typically, real components that can benefit from the improvements shown have a demanding geometric complexity. Manual data manipulation, especially considering the usual free-form surfaces, would not be practicable, not least because of the considerable time required. For this reason, a method was developed based on established slicing algorithms, making it possible to automatically derive the modified print data from a 3D model. The combination of sand and binder, as well as the desired layer thickness and the existing print head, are taken into account as input parameters in the program.
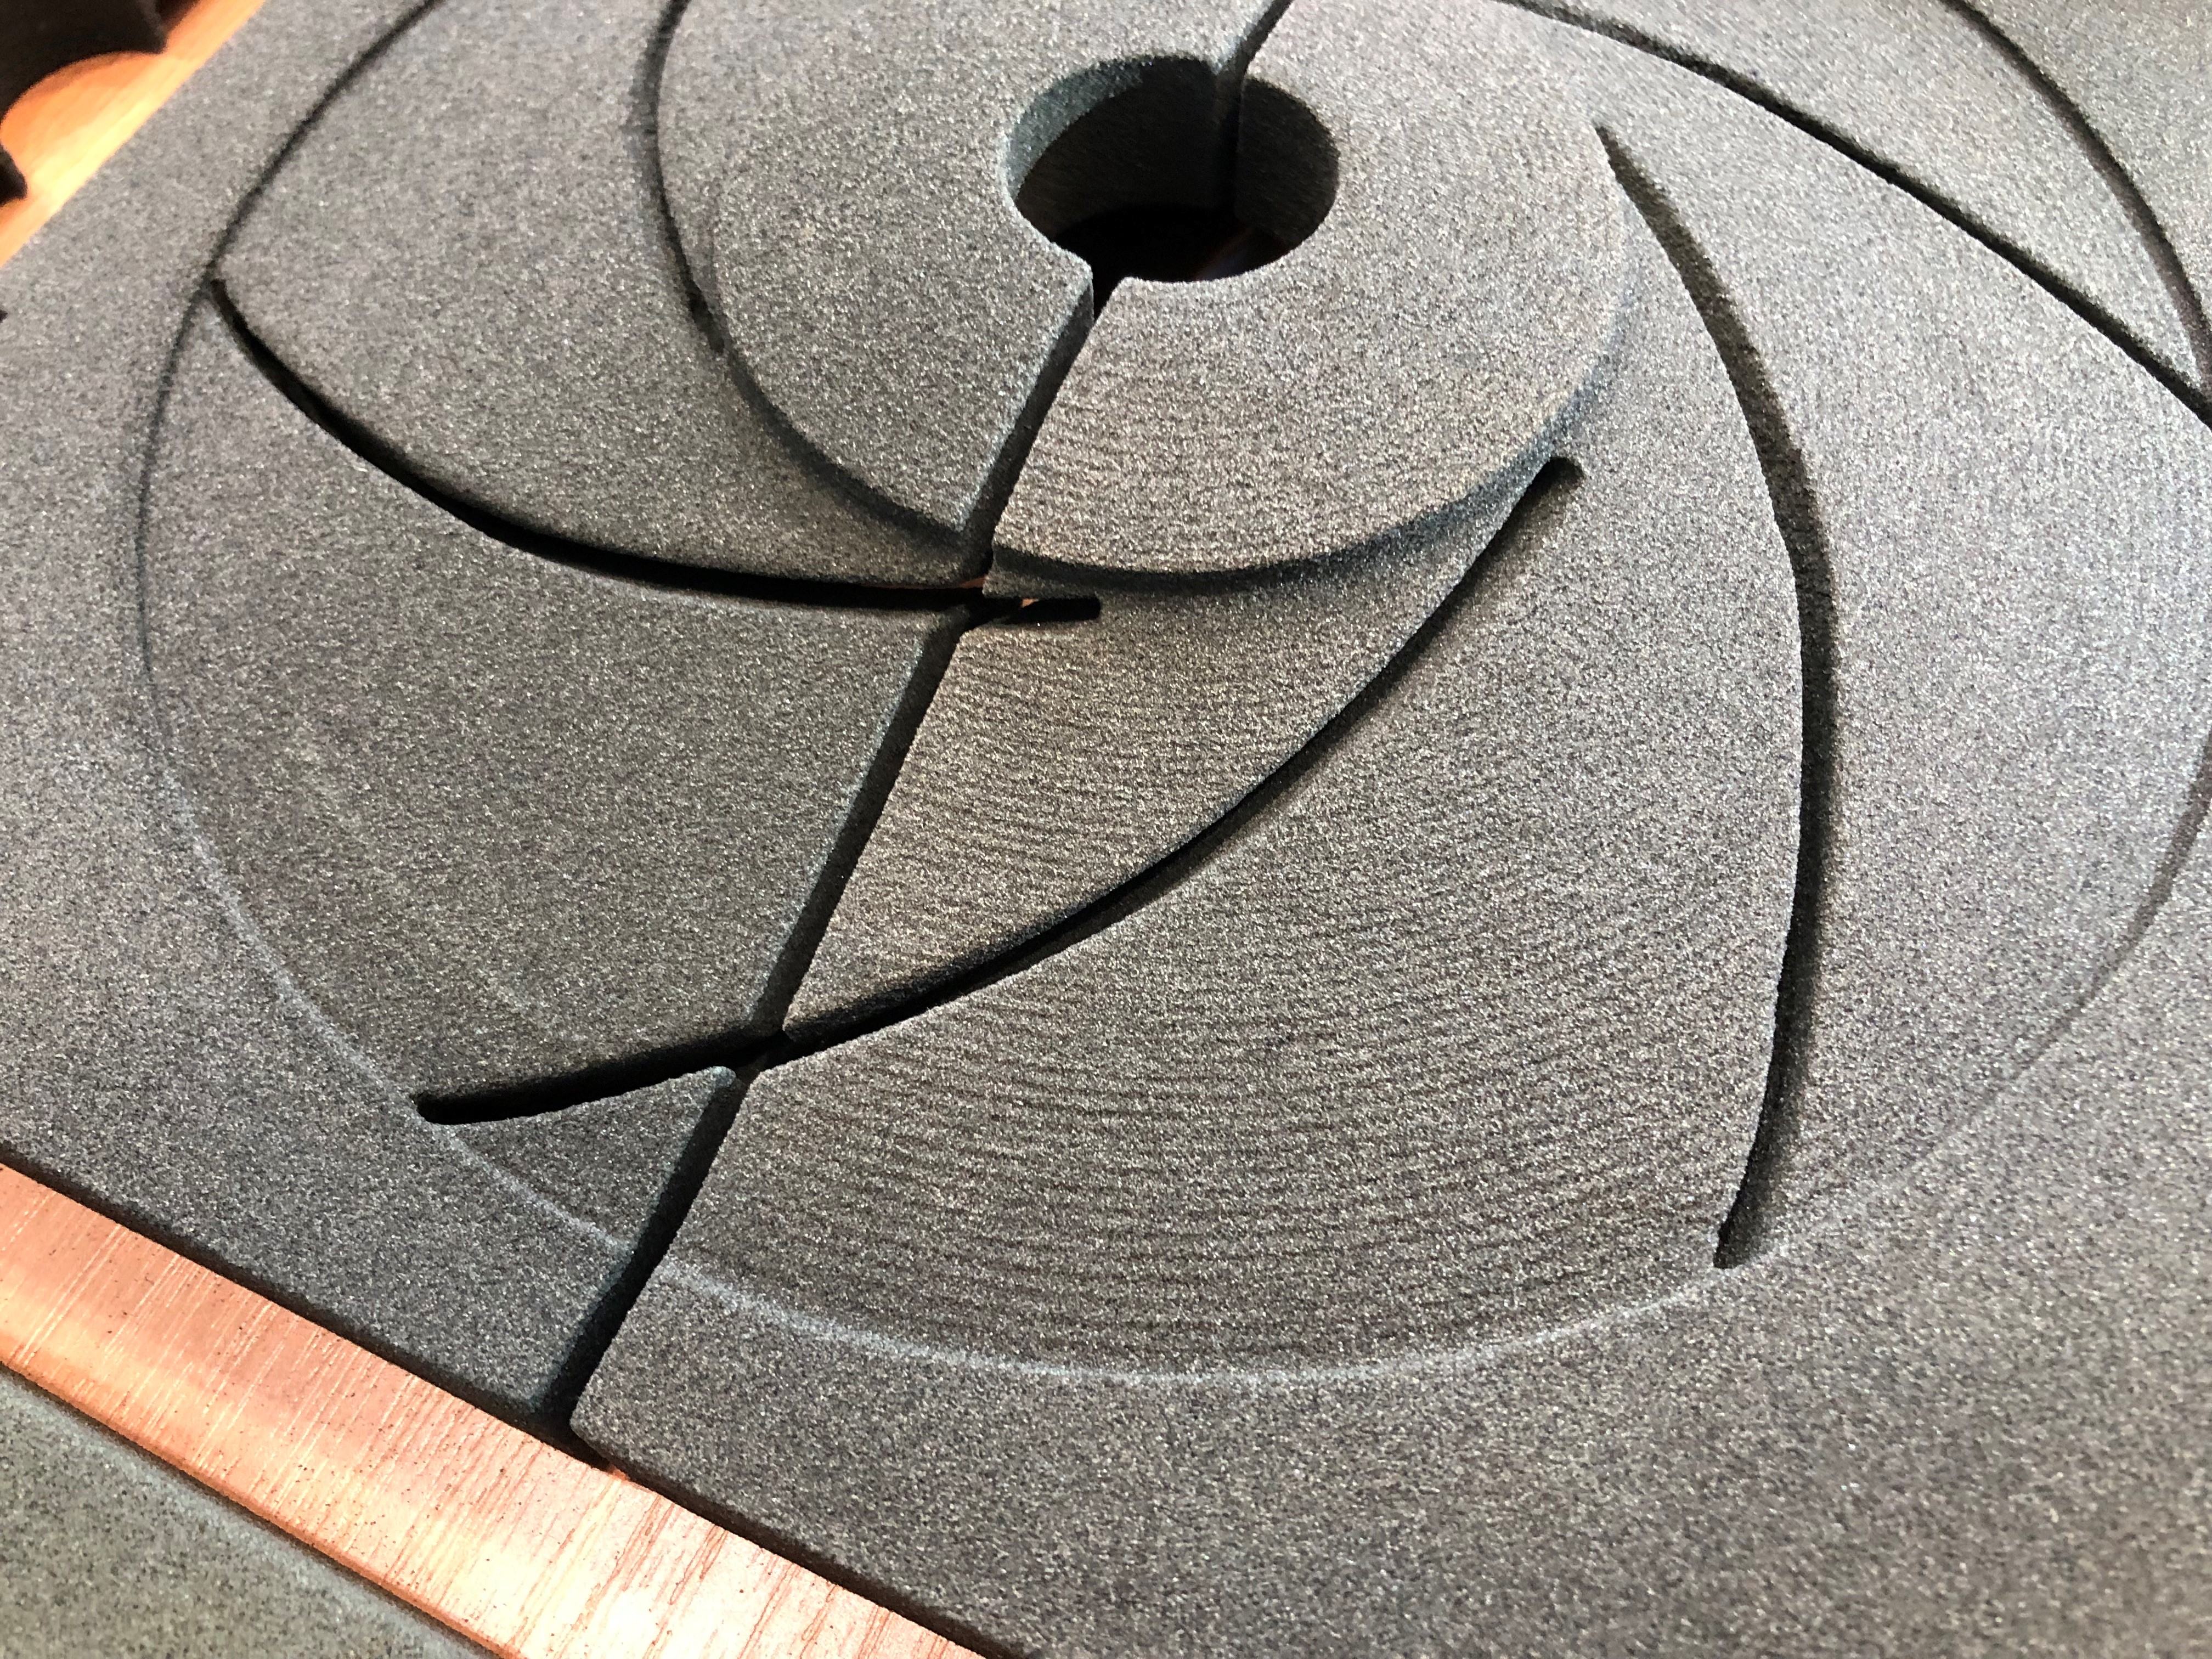
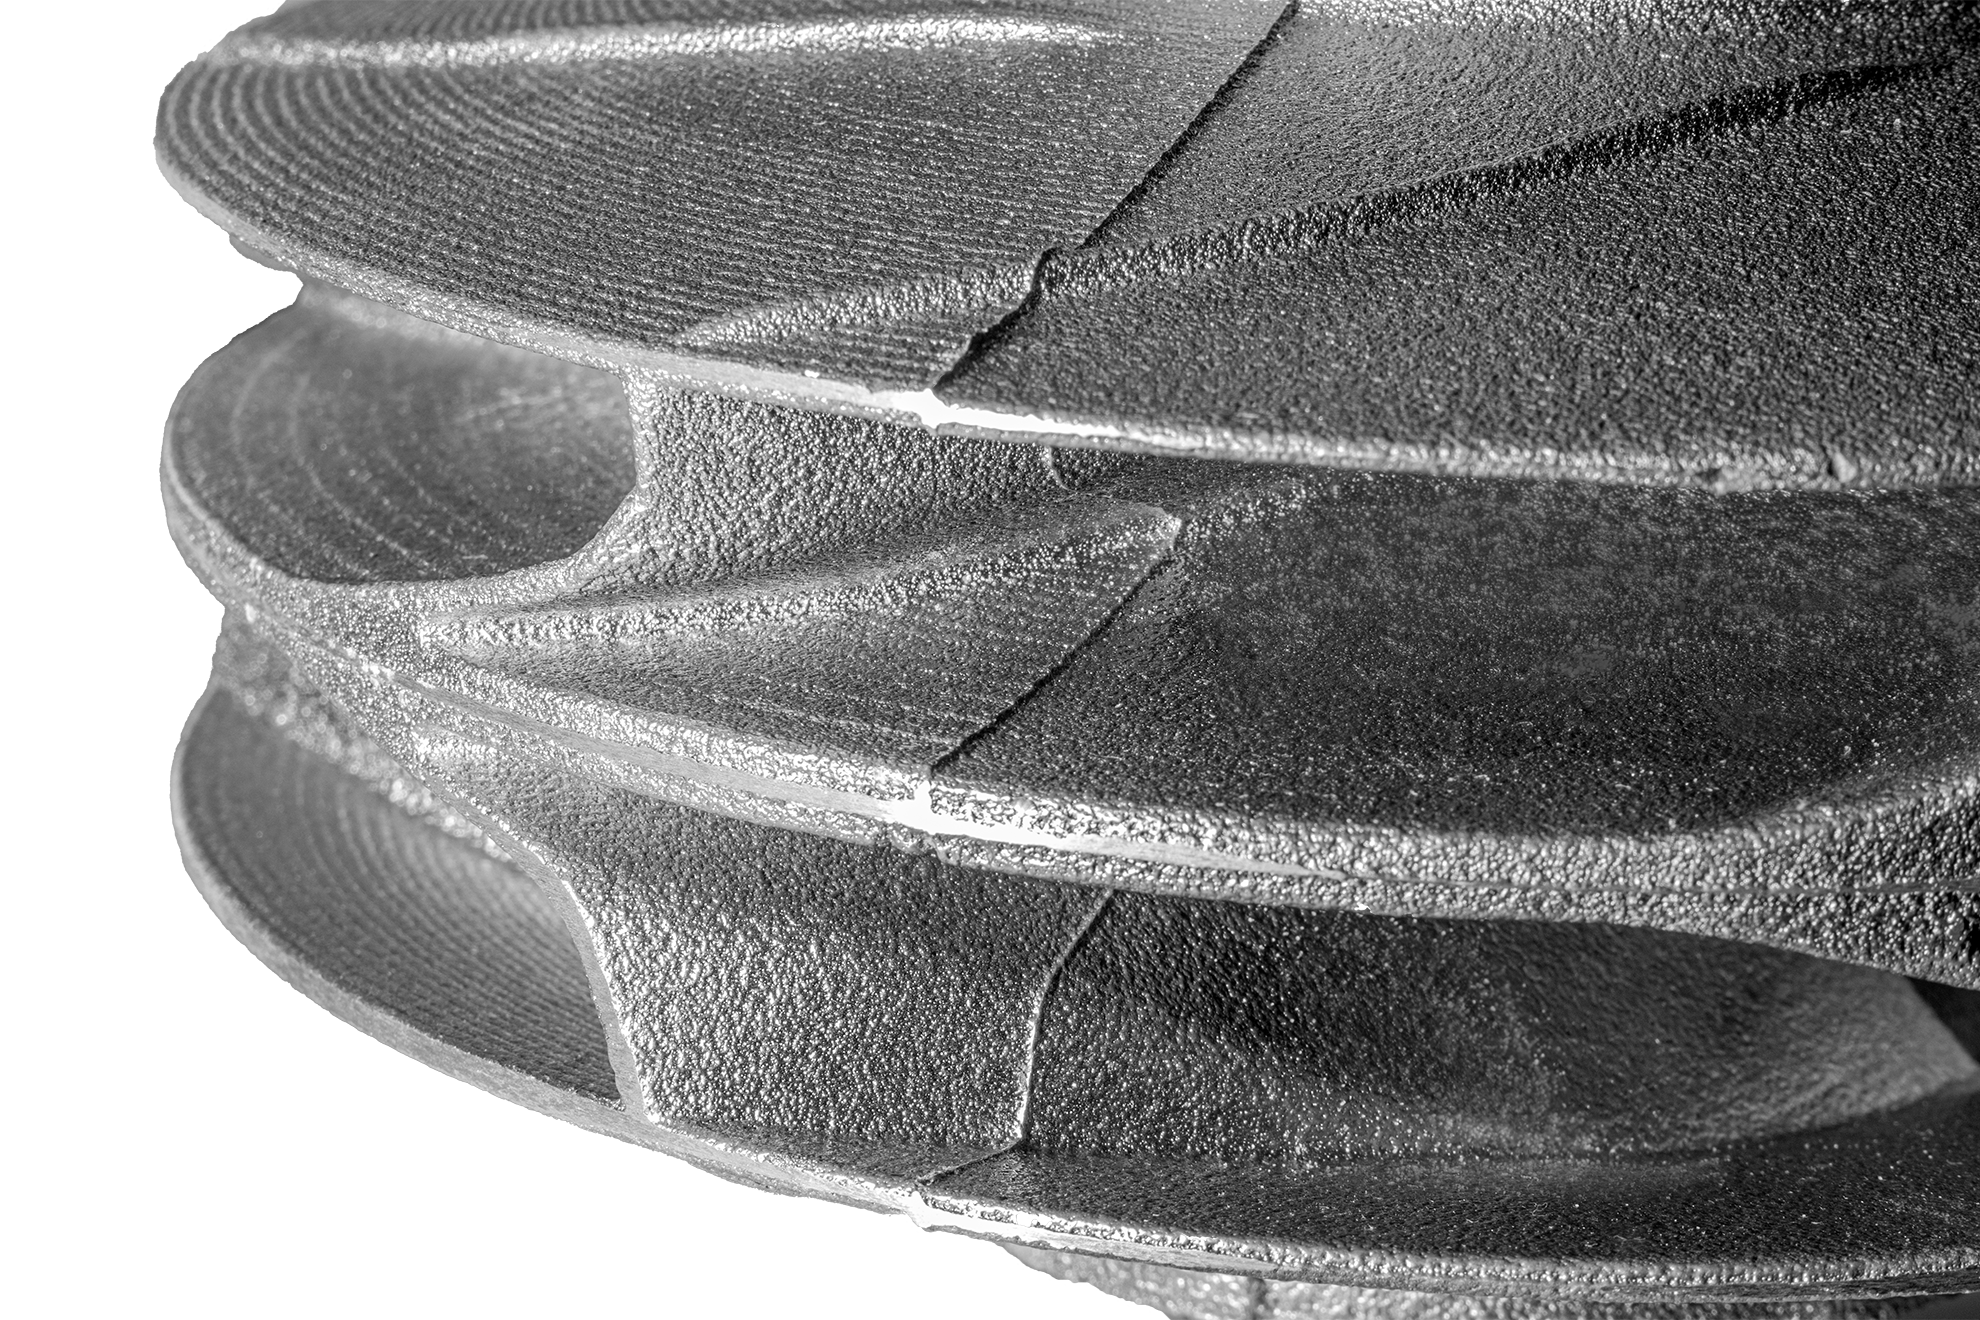
The smoothed surfaces are already clearly visible in the sand moulds (Figure 3). Using alternative data preparation, half of the mould with conventional steps and half of the mould with smoothed surfaces can be produced on the test system while maintaining the same shift time. The resulting cast part »Impeller«, built on an S-Max system from the manufacturer ExOne, illustrates the industrial possibilities of this process (Figure 4). In the case shown, one half of the mould was constructed conventionally, while the other half was created using the processed data. The two-part mould can be used to compare the change in surface quality.


